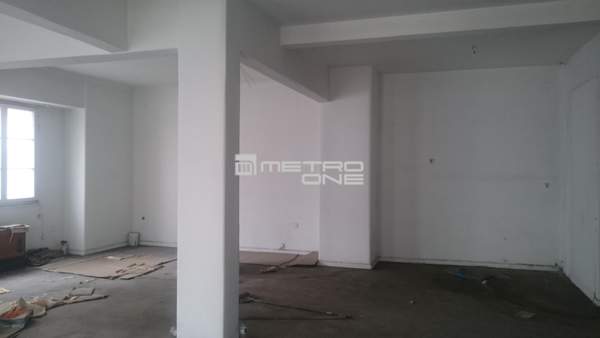
64 properties
Local agents share about the neighborhood
Who lives in the neighborhood?
Young locals, Local families, Local seniors, Tourists
What can an investor find in the neighborhood?
Long-term rental
Sense of security
Cleanliness and maintenance
How easy to find a tenant?
How easy to sell a property?
Who lives in the neighborhood?
Young locals, Local families, Local seniors, Tourists
What can an investor find in the neighborhood?
Long-term rental, Short-term rental
Sense of security
Cleanliness and maintenance
How easy to find a tenant?
How easy to sell a property?
Who lives in the neighborhood?
Young locals, Local families, Local seniors
What can an investor find in the neighborhood?
Long-term rental
Sense of security
Cleanliness and maintenance
How easy to find a tenant?
How easy to sell a property?
Neighborhood insights
The neighborhood has a metro station, Evangelismos Station, as part of line The Blue Line.
The neighborhood has a metro station, Kolonaki, as part of line The Orange Line.
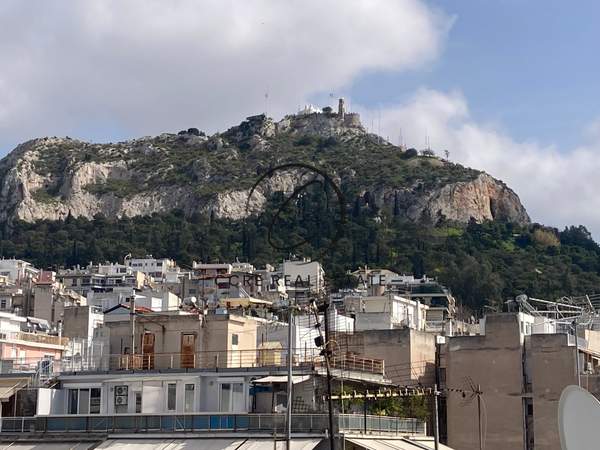
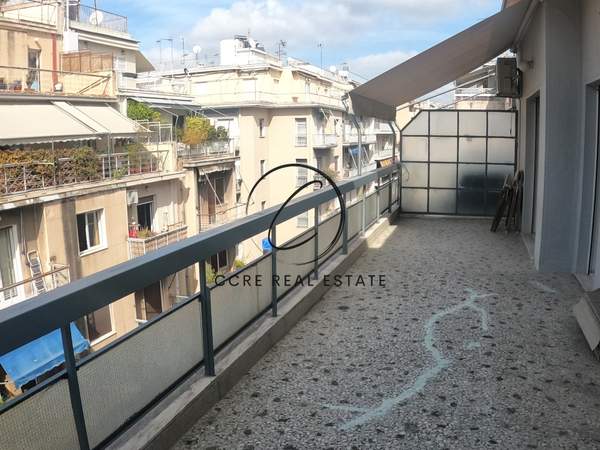
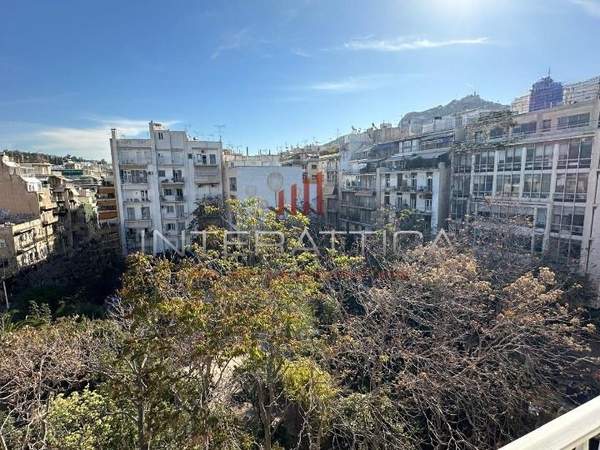
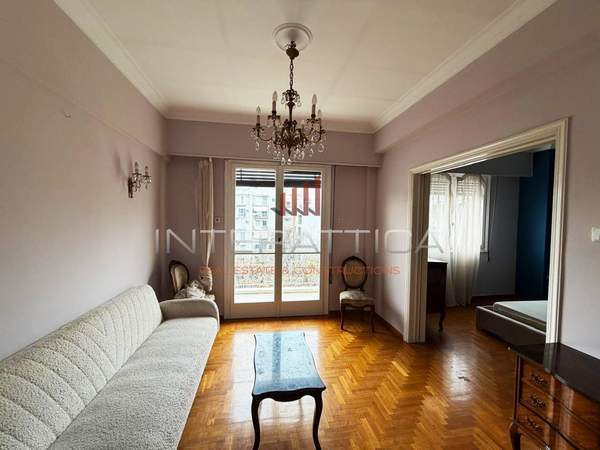
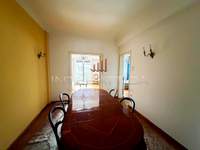
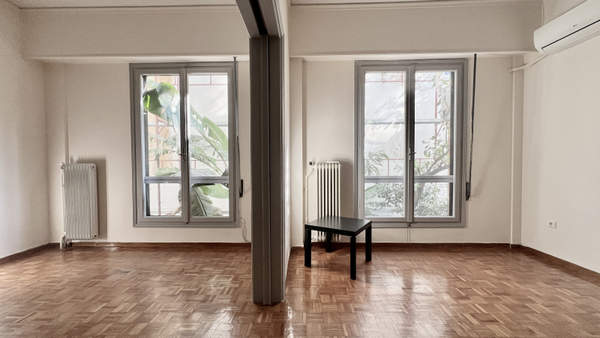
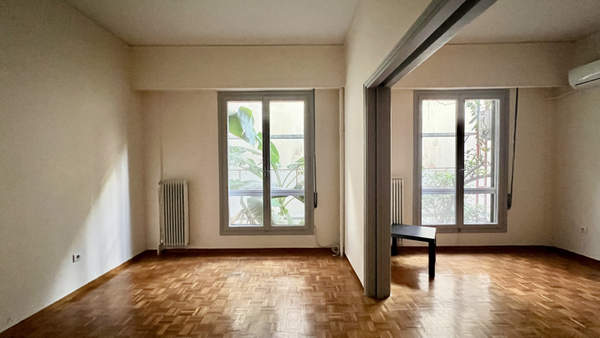
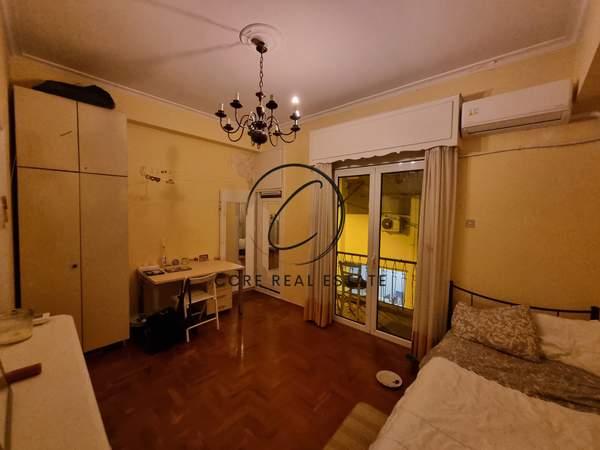
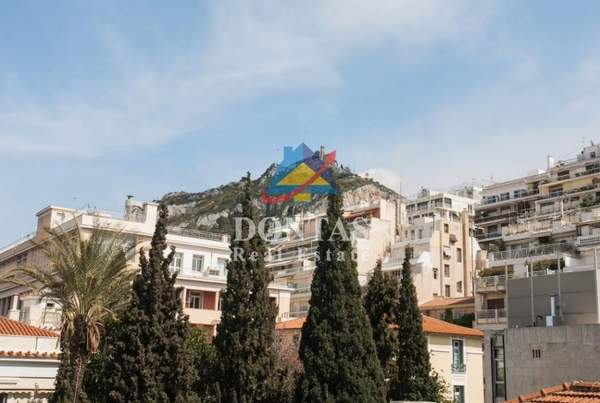
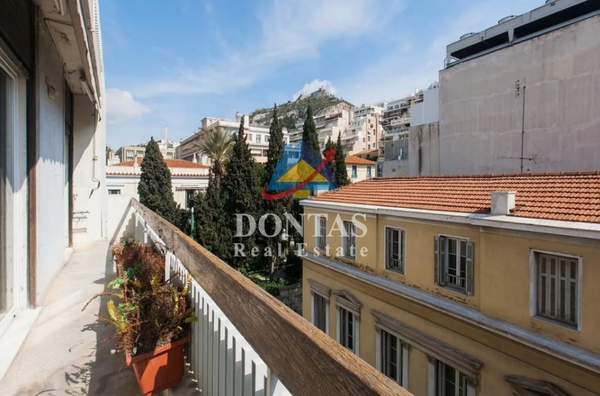
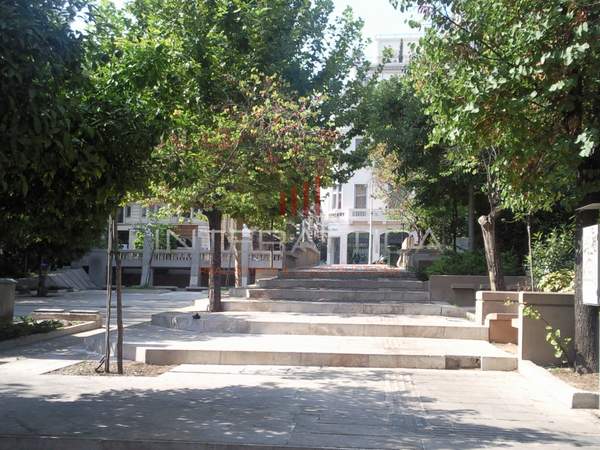
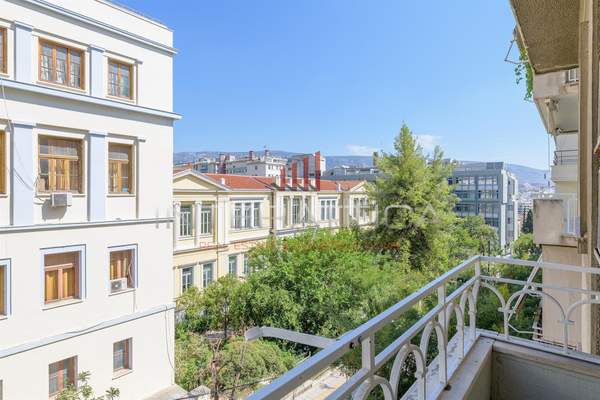
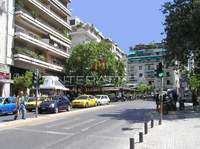
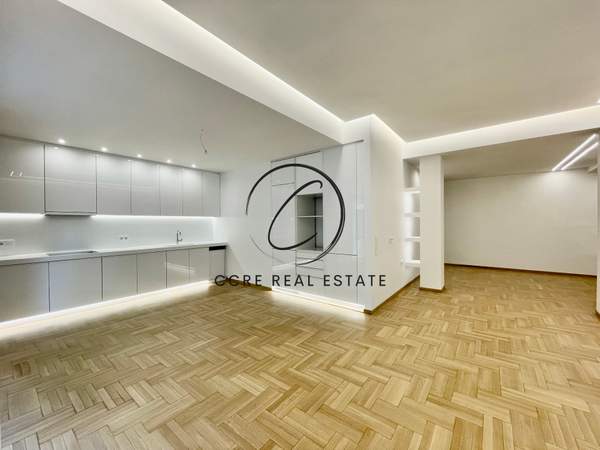
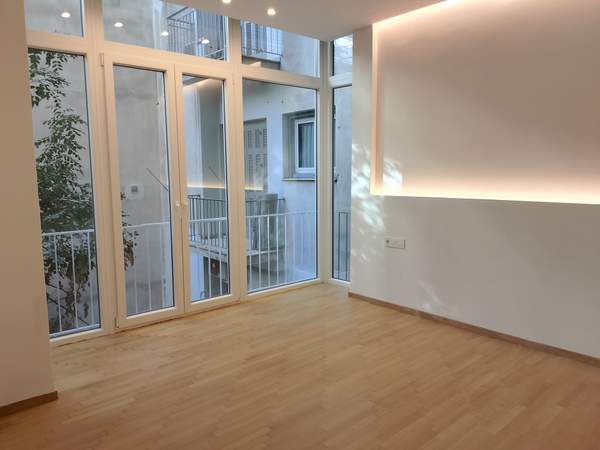
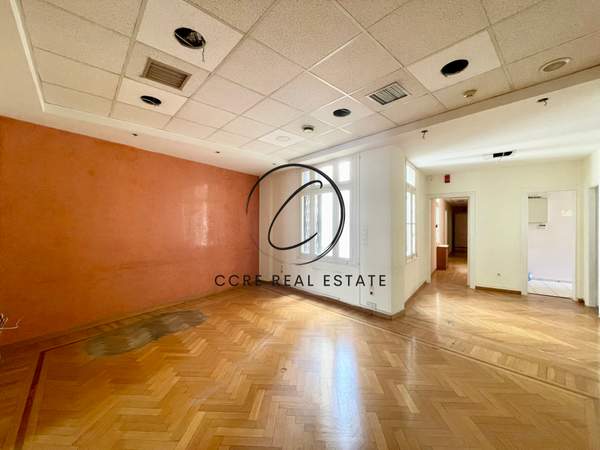
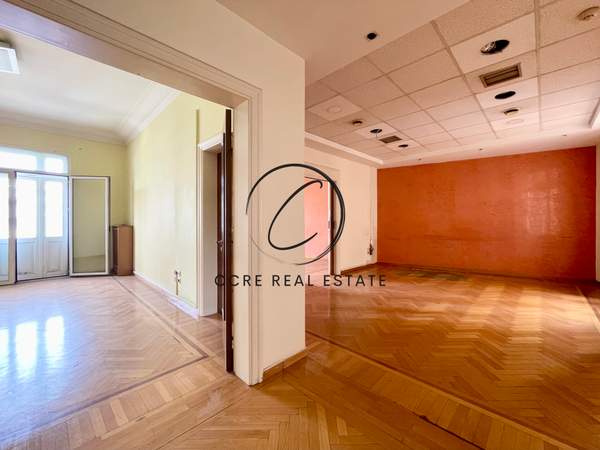
Kolonaki is a neighborhood in Municipality of Athens and the surrounding area with an area of 1.3 sq km. Currently, most listings in the area are 120+ sqm, but there are other sizes available. Average used price per sqm is about €6,698 with a gross yield of 4% On GREI there are 64 properties for sale in Kolonaki from a wide range of local agencies. Learn more about the neighborhood
Key metrics
New price per sqm
€11,909
Used price per sqm
€6,698
Monthly rent
€1,891
Gross yield
3.62%
Price list for neighborhood Kolonaki
Price per sqm
Total price
sqm
Used price per sqm
New price per sqm
Monthly rent
10-39
€6,340
-
€19
40-64
€6,722
-
€19
65-89
€6,192
-
€20
90-119
€6,774
-
€20
120+
€7,032
€11,909
€20
Prices do not represent ground floor or basement apartments, which are often lower by tens of percent. This list is not an official source or a substitute for professional advice.
View how available listings are distributed across different categories
Property distribution
Apartment size distribution (sqm)
Distribution by floor
Distribution by construction year
Year built
Up to 1960
26%
1960-1979
64%
1980-2000
5%
2000-2019
2%
2020+
3%