176 properties
Local agents share about the neighborhood
Who lives in the neighborhood?
Local families, Young locals
What can an investor find in the neighborhood?
Long-term rental, Multiple properties with flip potential
Sense of security
Cleanliness and maintenance
How easy to find a tenant?
How easy to sell a property?
Who lives in the neighborhood?
Local families, Immigrants
What can an investor find in the neighborhood?
Long-term rental
Sense of security
Cleanliness and maintenance
How easy to find a tenant?
How easy to sell a property?
Who lives in the neighborhood?
Local families, Immigrants
What can an investor find in the neighborhood?
Long-term rental
Sense of security
Cleanliness and maintenance
How easy to find a tenant?
How easy to sell a property?
Who lives in the neighborhood?
Local families, Immigrants
What can an investor find in the neighborhood?
Long-term rental
Sense of security
Cleanliness and maintenance
How easy to find a tenant?
How easy to sell a property?
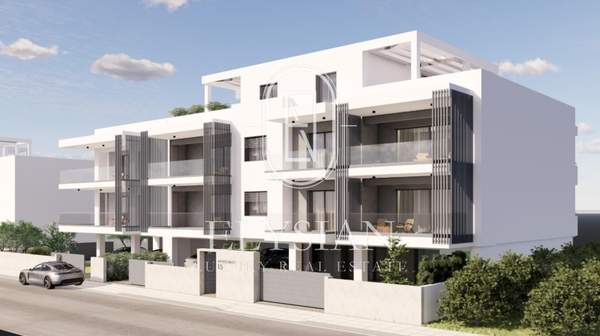
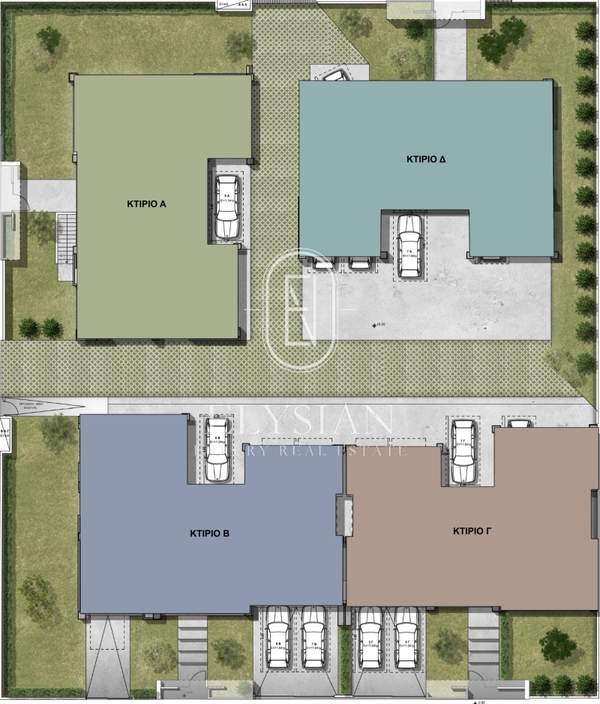
Neighborhood insights
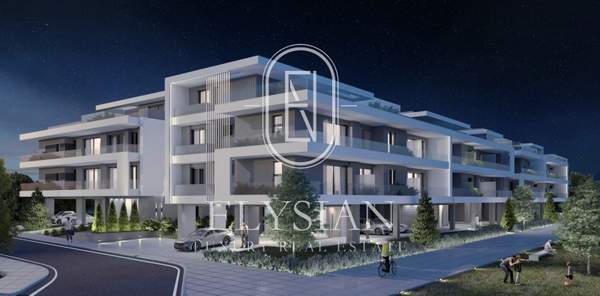
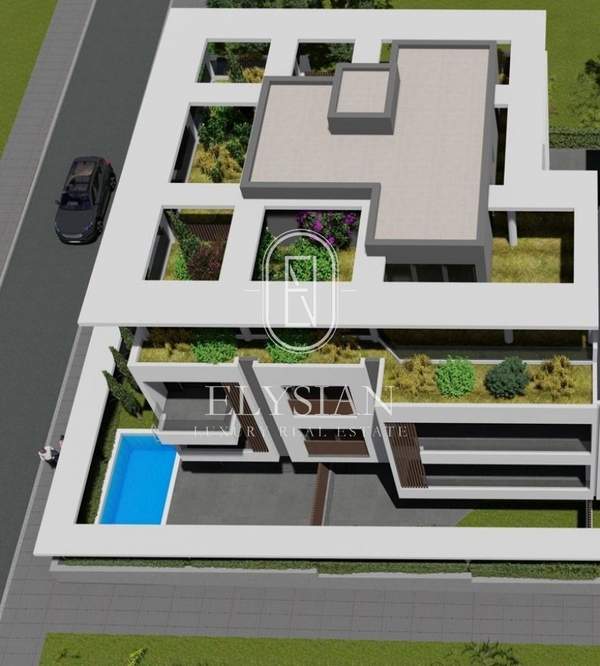
The neighborhood has a cultural and leisure institution, the Water Park.
Thermi is a municipality in thessaloniki and the surrounding area with an area of 380.1 sq km. Currently, most listings in the area are 120+ sqm, but there are other sizes available. Average used price per sqm is about €2,168 with a gross yield of 4% On GREI there are 176 properties for sale in Thermi from a wide range of local agencies. Learn more about the neighborhood
Price list for municipality Thermi
Price per sqm
Total price
sqm
Used price per sqm
Monthly rent
10-39
€2,728
€13
40-64
€2,396
€9
65-89
€2,265
€7
90-119
€2,287
€6
120+
€1,944
€6
Prices do not represent ground floor or basement apartments, which are often lower by tens of percent. This list is not an official source or a substitute for professional advice.
Key metrics
New price per sqm
-
Used price per sqm
€2,168
Monthly rent
€804
Gross yield
4.14%
View how available listings are distributed across different categories
Property distribution
Apartment size distribution (sqm)
Distribution by floor
Distribution by construction year
Year built
Up to 1960
0%
1960-1979
1%
1980-2000
12%
2000-2019
35%
2020+
52%